
U.S. AGRICULTURAL REGION TO SPLIT BETWEEN WARM/DRY SOUTH AND MILD/WETTER NORTH AS LA NIÑA RAMPS UP…
Outlook Overview
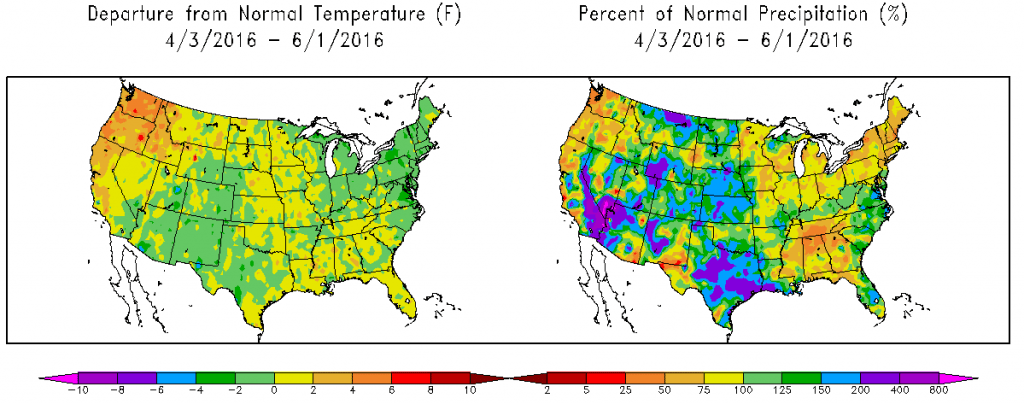
- Spring 2016 marked a transitional phase out of a strong El Niño and towards neutral conditions. As such, spring weather over the U.S. growing region has been capricious, but slightly warmer and notably wetter than average in the Plains. The Ohio Valley and especially the Deep South trended drier in May.
- As the Pacific shifts from neutral to weak La Niña conditions by late summer, look for a continued volatile weather pattern over the U.S. agricultural zone. However, a more coherent temperature and precipitation anomaly tendency is likely to become more apparent by the end of the summer as negative ENSO conditions more strongly emerge.
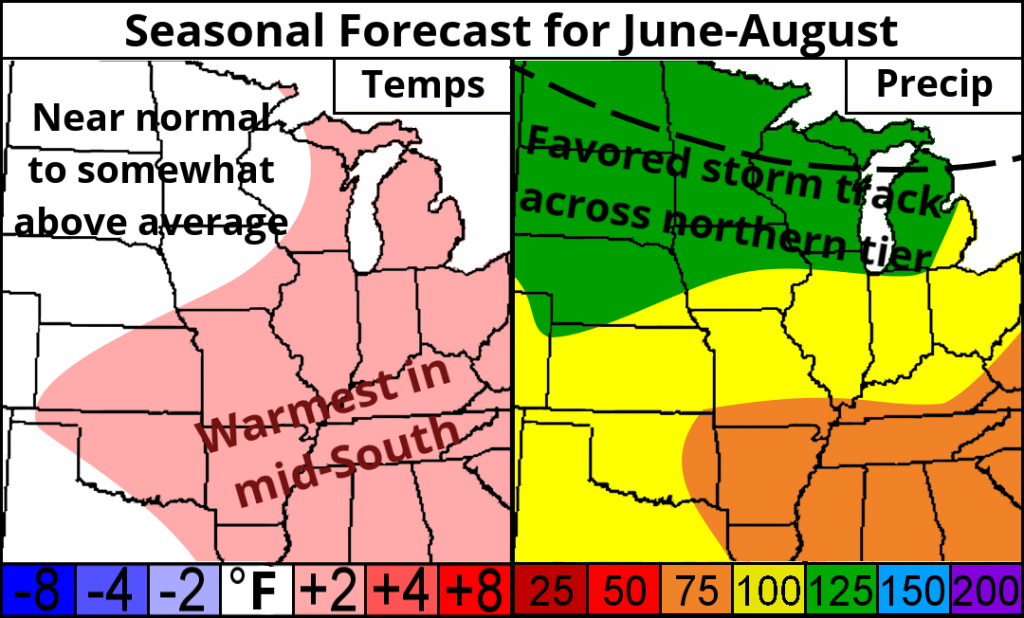
- Generally, June through August will be characterized by near normal temperatures and normal to above average precipitation in the northern Plains and western sections of the corn belt due to a favored storm track through areas. In contrast, the U.S. southeast looks to be warmer and drier than normal with a tendency for persistent southern tier ridging. The eastern corn belt is likely to be somewhat warmer than average, but still see fairly normal precipitation overall as it trends drier by the end of summer.
General Outlook for Central and Eastern U.S. Growing Regions
The spring of 2016 was again was marked by volatility and contrasts. Temperature-wise, the central and eastern U.S. region ranged from an average of near to above temperatures in the Plains and Deep South, to below average temperatures in the Ohio Valley and mid-Atlantic. May in particular was quite cool in the eastern U.S., as persistent troughing over the eastern Great Lakes brought several unseasonably prolonged cold snaps. This pattern also lead to a split in precipitation anomalies from west to east. Texas was inundated by a series of slow-moving upper-level lows that broke away from the main jet stream, leading to localized flooding, and the rest of the southern and northern Plains also picked up well above average seasonal rainfall totals from some of these disturbances. The Ohio Valley saw several extended periods of rainfall and cool weather that delayed planting in some locations, but generally managed near normal rainfall totals over April and May. However, the eastern Delta and Deep South saw below normal precipitation, particularly in May.
As summer gets off to a warm start in the eastern U.S., it’s time to l ook ahead to June, July, and August and take a look at how temperature and precipitation anomalies may shape up this growing season for the corn belt, southern Plains, and Mississippi Delta regions. The central and eastern U.S. agricultural belts enter the planting season in fairly good shape, with the exceptions being some regions of excessive rainfall and recent flooding in central and eastern Texas and southeastern Oklahoma. In terms of global climate drivers, the vigorous El Niño that dominated weather worldwide over the winter has utterly collapsed over the past two months; see the huge changes in sea surface temperature (SST) anomalies in region 1 in the map at right. Dynamical models (bottom panel, right) are now in good agreement that a full-blown La Niña will develop by the summer. This type of rapid change usually drives some instability in global weather patterns, so the first half of the summer may be a truly mixed bag over the U.S. ag region. This is compounded by rapid changes in SST in two other key regions known to have an influence on summer weather (regions 2 and 3 on the map). Some of these changes have been very, very poorly predicted (or even captured in real-time) by long-range climate models, which leads me to be highly skeptical of such models’ predictions for U.S. summer weather.
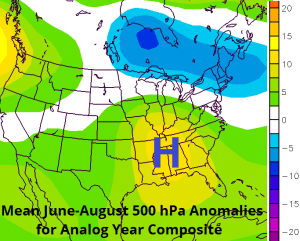
As such, it is instructive to take a look at some other springs that shared these key characteristics with spring 2016, and see what conditions in aggregate were observed in the following summers. Searching for springs that were characterized by a trend towards a transition between El Niño and La Niña, and generally similar conditions in the subtropical Atlantic and Pacific matches the years 1958, 1973, 1988, 1998, 2007, and 2010. Of this set, 1998 is the best match and 2007 and 2010 are stronger matches for 2016, so more weight is given to these analogs in the analysis. At left below is the resulting average 500mb anomaly for June, July and August over that set of analog years. Those six summers mostly share a tendency for ridging over the south central U.S., with relatively low variance. This increases confidence that a similar trend will be in store this year.
 What does this mean in terms of temperature and precipitation relative to normal?
For the most part, this means a reversal of this winter’s general pattern, and a continuation of some of the trends that have developed over the latter half of May. These trends include a diminishing of moisture availability over the southern and eastern U.S. over the course of the summer as the subtropical jet shifts north, and a general tendency for periodic heat waves and above normal temperatures in these regions due to anomalous subsidence. WeatherTiger’s seasonal forecast for average temperature anomalies are shown at left below, with precipitation anomalies at right. In general, the Plains will see near normal temperatures and more frequent precipitation chances as the favored average storm track rides along the U.S. northern tier, with normal diurnal thunderstorm chances in the southern Plains associated with the mean moist southerly flow on the western flank of the southeastern ridge with closer to average temperatures across the southern tier. Otherwise, above average temperatures and below average precipitation will be more prevalent the further south and east. This analog technique very likely glosses over significant intraseasonal variability (discussed further below) and is fraught with the possibility of drawing excessive conclusions from a small sample set of years, so I’ve also prepared some proprietary statistical models for June-August mean temperatures in the three main U.S. growing regions. The predictions of these models are blended with the pattern-based method into region-specific seasonal guidance, given below.
June, July and August Forecast for the Western Corn Belt including MN, ND, SD, NE, and IA
TEMPERATURES: Summers marked by transitional phases between strong El Niño and weak La Niña conditions tend to be near normal to somewhat cooler than average in the western corn belt for the first half of the season, before trending warmer later in the summer. The recent weakening of the warm Pacific Decadal Oscillation phase supports this potential trend, so look for three-month mean temperatures to be near normal north and west of Iowa, with warmest anomalies on the eastern half of the region.
PRECIPITATION: The western belt will likely see periodic disturbances riding along the northern tier of the U.S., as well as an ample Gulf moisture tap with southerly winds. Thus, I expect somewhat above normal rainfall in the western belt, which should be reasonably evenly distributed over the whole summer.
June, July and August Forecast for the Eastern Corn Belt including WS, OH, IN, IL, and MI
TEMPERATURES: The Ohio Valley marks a transitional zone between the drier and warmer weather expected to its south and east and the milder and wetter conditions expected to the north and west. Look for the mean latitude of the southeastern ridge to gradually shift north over the summer, bringing a warming trend to the zone through August. Overall, look for a three-month mean temperatures that are somewhat above average temperatures, or perhaps about +2F relative to average generally.
PRECIPITATION: If analog methods are accurate, the eastern belt will see a fairly notable shift between modestly wetter than average conditions over the first half of the summer and a drier than average in the second half, caused by a northwest shift in the favored storm track and the aforementioned mean ridge positioning changes. Overall, the region can expect near normal precipitation over the full period, with a dry August, particularly in the southern Ohio Valley.
June, July and August Forecast for the S. Plains/Mississippi Delta including TX, OK, AR, KS, and MO
TEMPERATURES: As large sections of the southern Plains and Mississippi Delta have seen excessive rainfall over the past three months, saturated soils will likely moderate temperature anomalies somewhat this summer, despite the region being located near a tendency for ridging. Therefore, look for merely somewhat above average temps in the southern tier, with the warmest anomalies east.
PRECIPITATION: Significantly above normal recent rainfall will make surface moisture flux a key supporter of continued thunderstorm-driven precipitation this summer, along with the region’s positioning generally to the west of the high. One caveat is that rainfall accumulations may be locally idiosyncratic due to the convective nature of the expected rainfall. Look for generally near normal precipitation here with a drying trend over the summer, with somewhat below normal rainfall in the eastern Delta portion of this zone.
That’s your look ahead at this summer’s weather. The rapid recent (and continuing) changes in global climate drivers make it a bit of tricky forecast, but there’s enough internal consistency in similar years to 2016 to give at least some confidence that there will be tendency for a U.S. a pattern reminiscent of this general forecast idea. HAGS*, and as always, keep watching the skies!
*That’s Have A Great Summer, for those of you who didn’t sign a lot of yearbooks between 1995-2002.